How to use histograms to create better images
- Hana A.
- Nov 28, 2017
- 1 min read

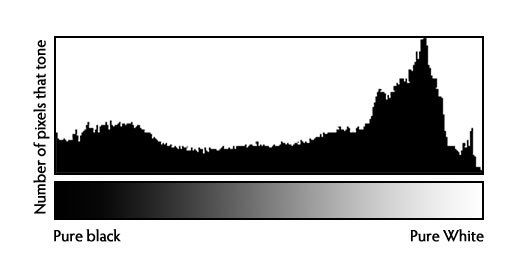
Dictionary definition: A Histogram is a bar graph of a frequency distribution in which the widths of the bars are proportional to the classes into which the variable has been divided and the heights of the bars are proportional to the class frequencies.
Many things we can learn about Histograms has to deal with exposure and saturation in a photograph you've taken. Gaps on either end indicate you are missing information and your exposure can be shifted safely without losing detail. When your graph is shifted too far in one direction or the other so that it does not even touch the other edge – that means you can safely shift your exposure to cover more of the range of tones.


Comments